Announcing our partnership with Julius
Financial Datasets Team · 3 min read

Julius now has real-time financial market data. Users can pull the latest earnings, financial statements, stock prices, insider trades, and more just by prompting. Our API is the data layer behind it.
What used to take a morning
Comp tables, DCF models, margin trend analyses. An analyst might spend hours copying data between tabs to put together a single comp. In Julius, you just type what you want.
Here are a few prompts we ran.
Comp table with valuation and margins
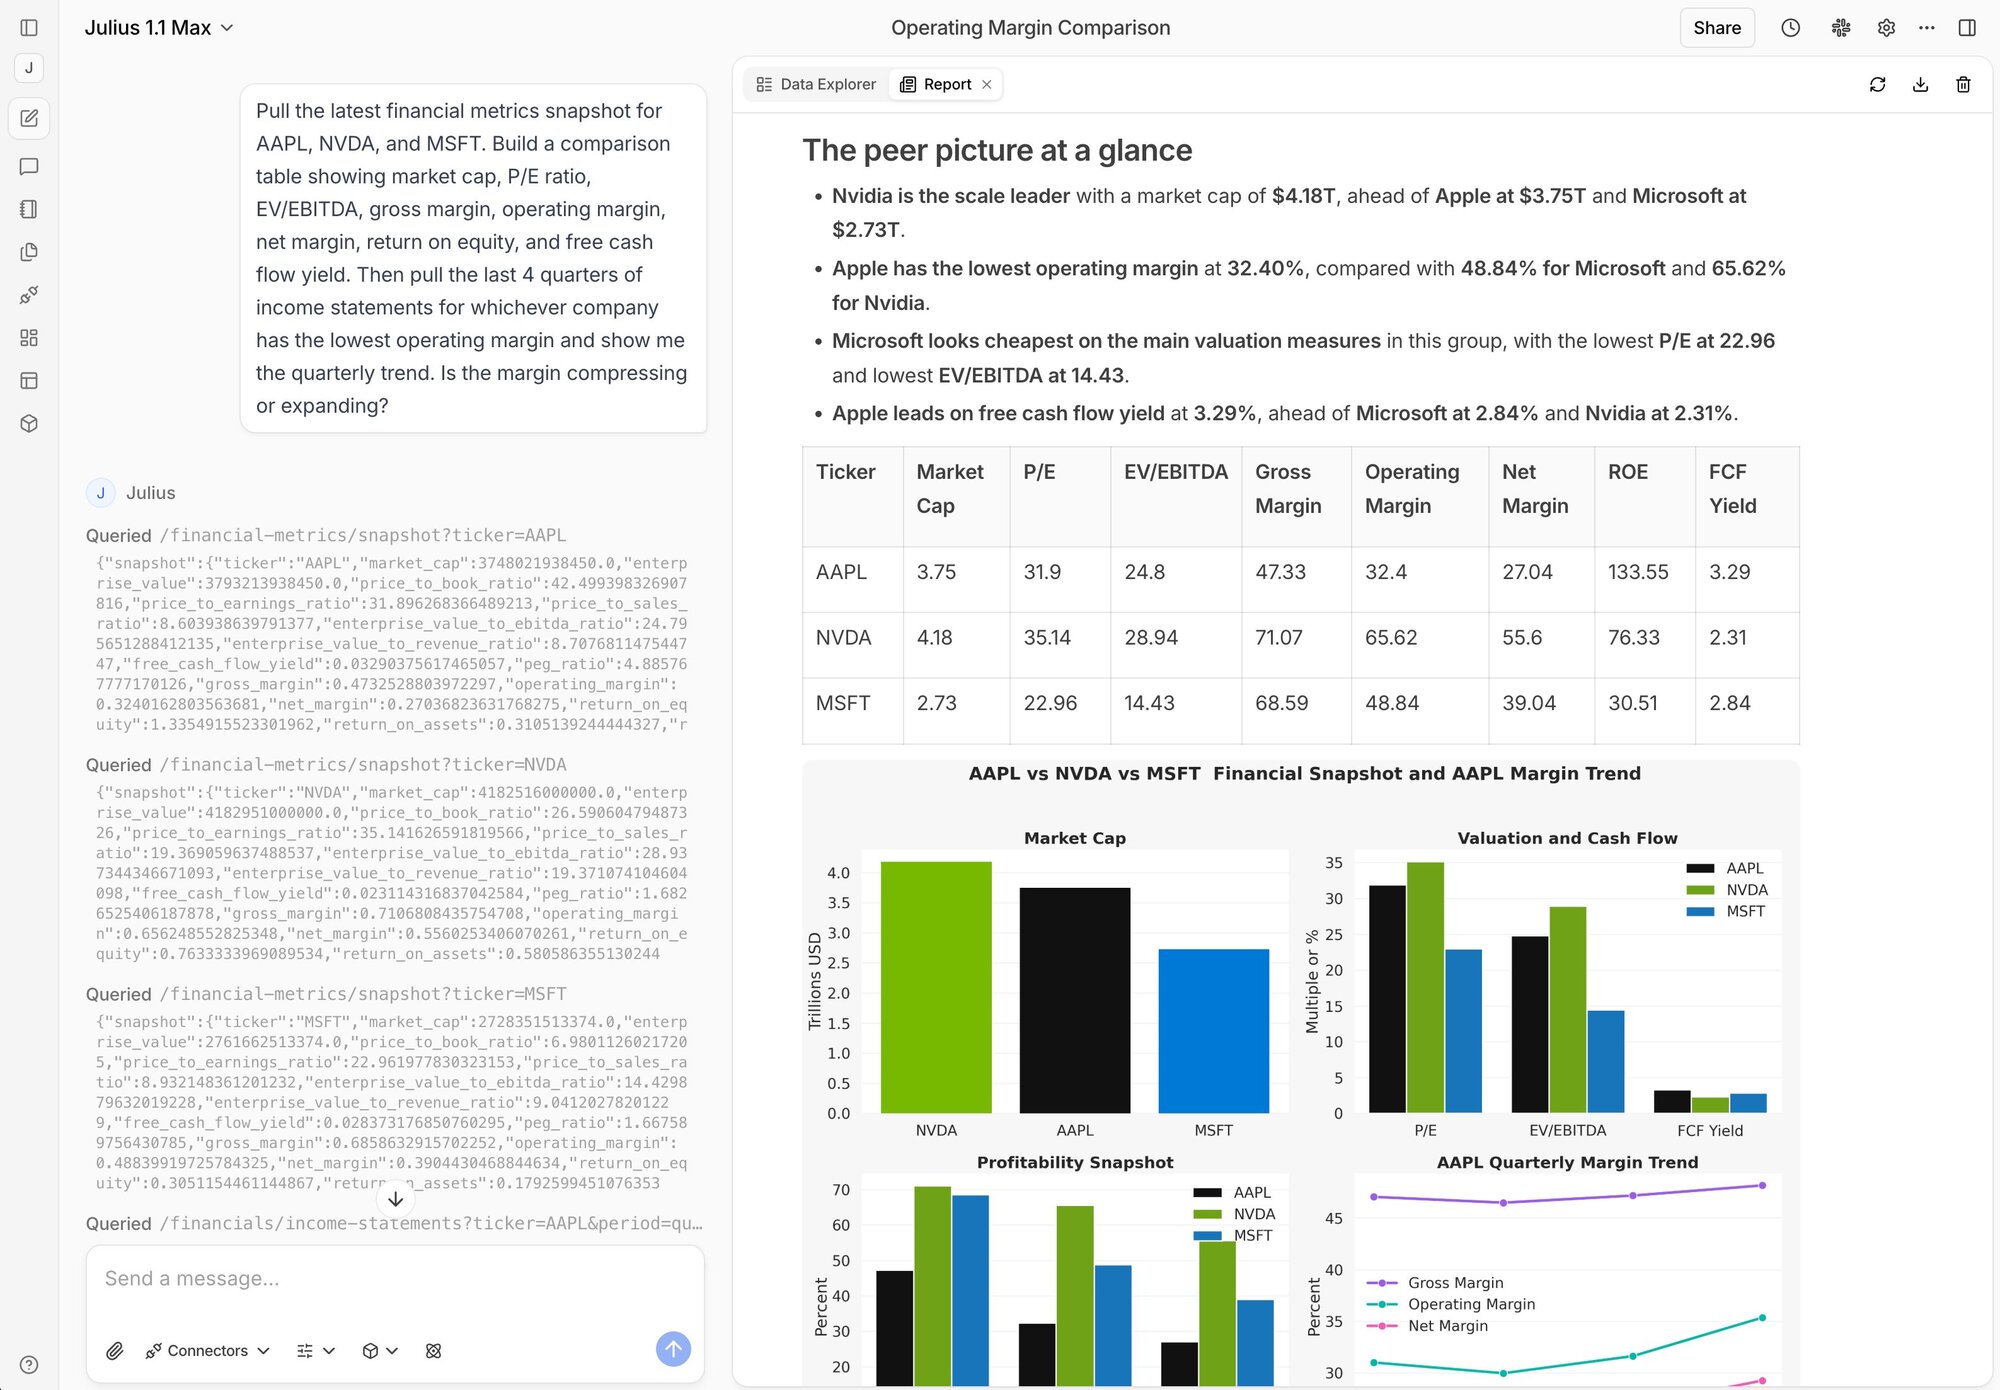
Pull the latest financial metrics snapshot for AAPL, NVDA, and MSFT. Build a comparison table showing market cap, P/E ratio, EV/EBITDA, gross margin, operating margin, net margin, return on equity, and free cash flow yield. Then pull the last 4 quarters of income statements for whichever company has the lowest operating margin and show me the quarterly trend. Is the margin compressing or expanding?
Julius pulled live snapshots and quarterly income statements from our API, built the comp table, found the company with the lowest operating margin, and charted the quarterly trend. One prompt, maybe 15 seconds.
Debt coverage and balance sheet health
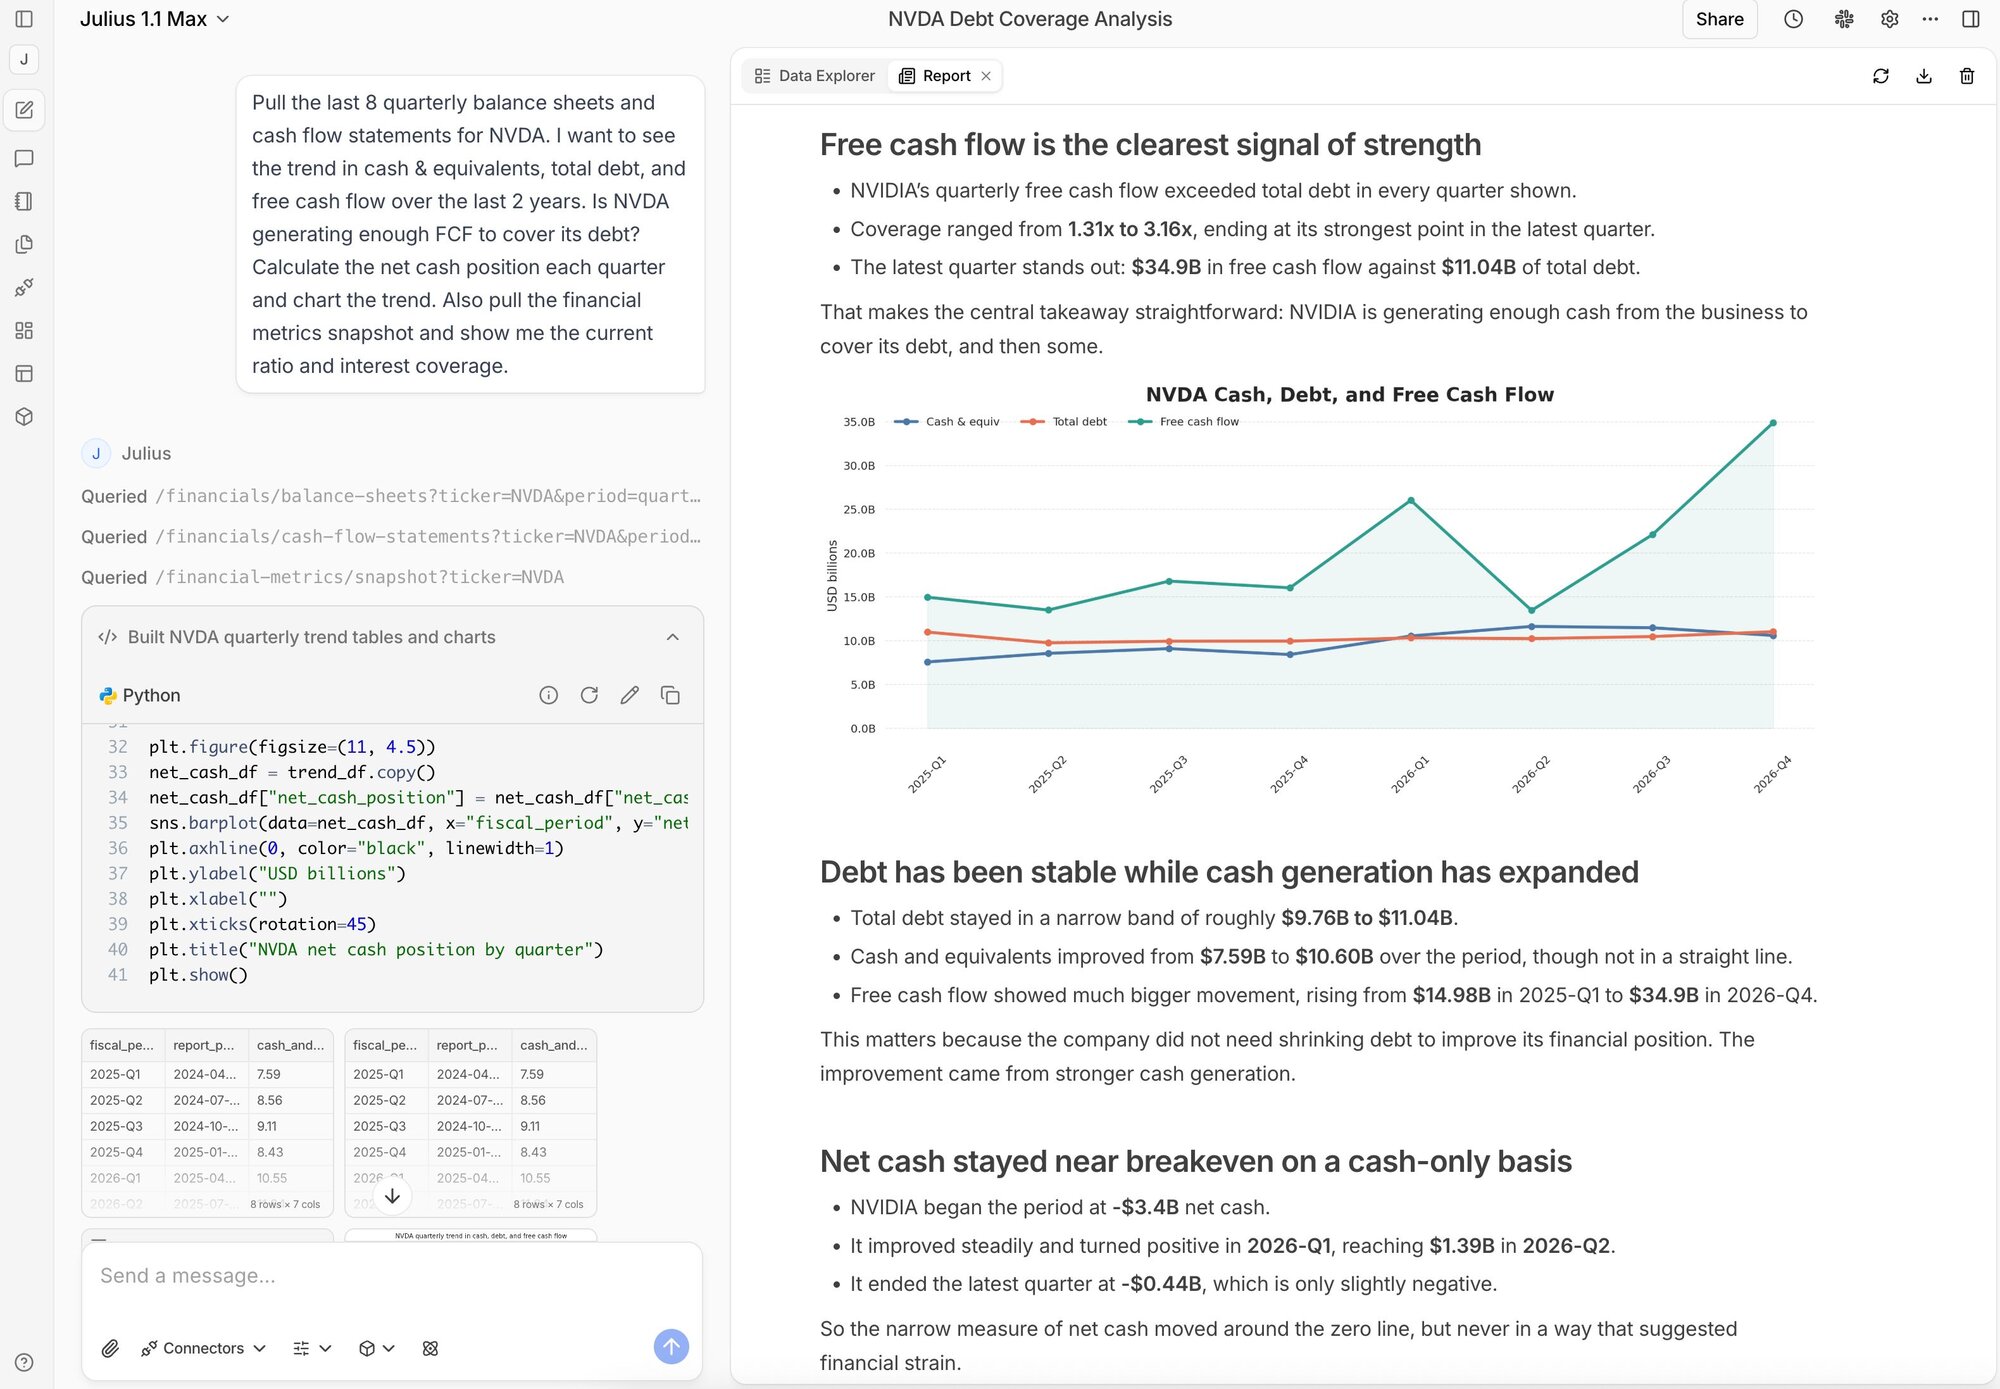
Pull the last 8 quarterly balance sheets and cash flow statements for NVDA. I want to see the trend in cash and equivalents, total debt, and free cash flow over the last 2 years. Is NVDA generating enough FCF to cover its debt? Calculate the net cash position each quarter and chart the trend. Also pull the financial metrics snapshot and show me the current ratio and interest coverage.
This one hit three of our endpoints (balance sheets, cash flow statements, metrics snapshots), stitched the data together, generated charts, and wrote a summary with actual conclusions about NVDA's debt coverage.
Revenue mix
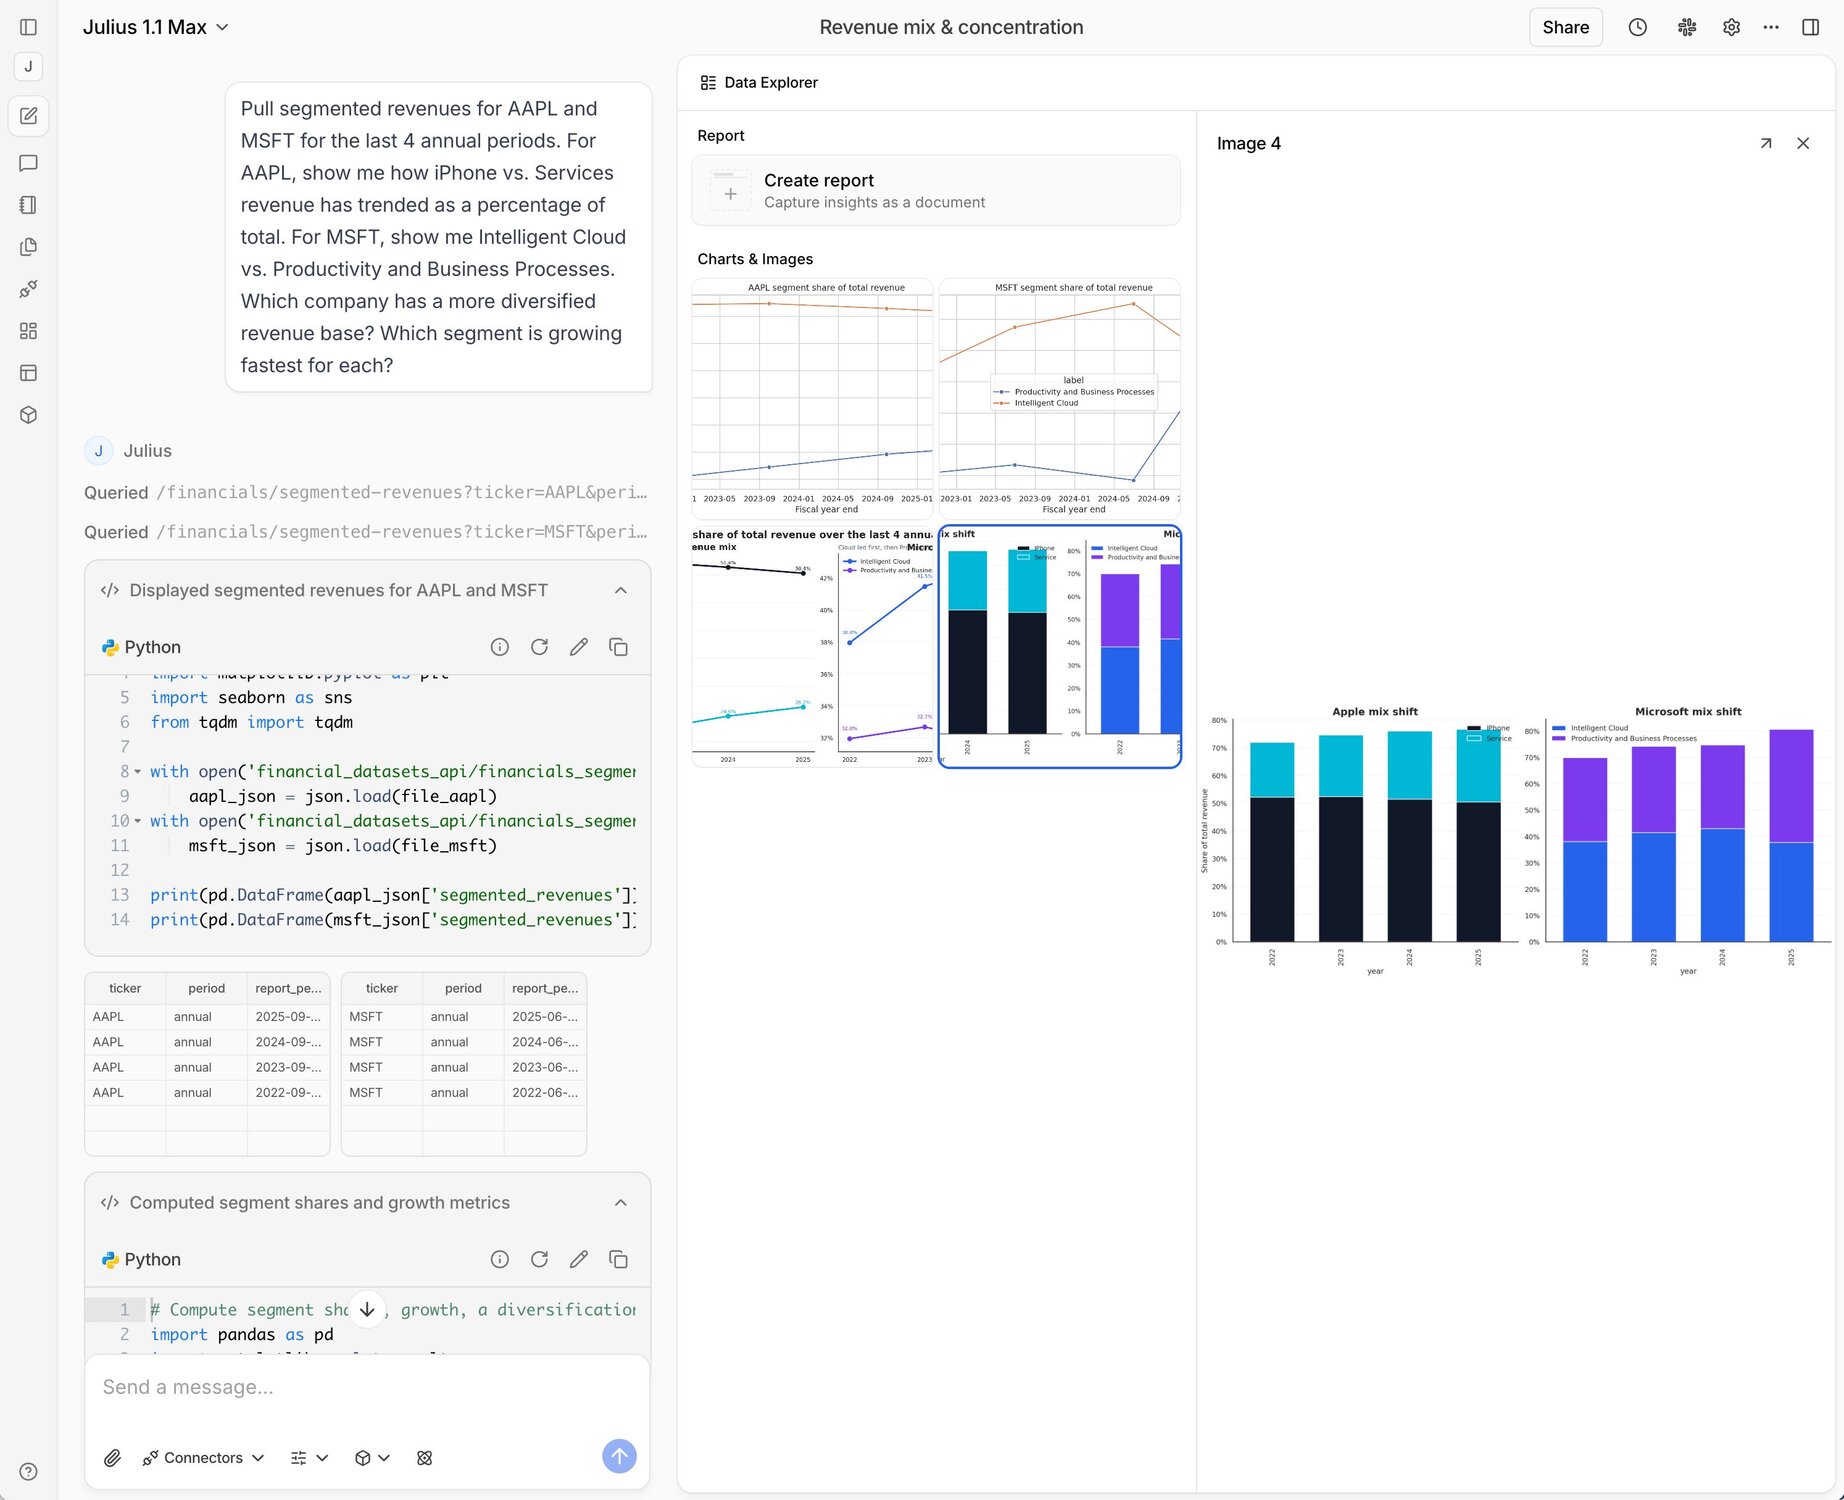
Pull segmented revenues for AAPL and MSFT for the last 4 annual periods. For AAPL, show me how iPhone vs. Services revenue has trended as a percentage of total. For MSFT, show me Intelligent Cloud vs. Productivity and Business Processes. Which company has a more diversified revenue base? Which segment is growing fastest for each?
Extracting segment data used to mean downloading 10-K filings and pulling numbers out of tables by hand. Julius grabbed the data from our segment breakdowns endpoint and did the comparison automatically.
What data is available
Julius users can query a broad set of our endpoints:
- Earnings reports and earnings surprises
- Income statements, balance sheets, and cash flow statements (quarterly and annual)
- Financial metrics snapshots (P/E, EV/EBITDA, margins, etc.)
- Segmented financial data (revenue, operating income, assets, and more by segment)
- Insider trades
- Stock prices and historical data
All real-time. You can also query it alongside your own datasets, spreadsheets, or data warehouse connections already in Julius, so you can put public market data next to your internal numbers from Snowflake or BigQuery in the same conversation.
Try it
Financial Datasets is available today for all Julius users. Open Julius, ask about any publicly traded company, and see what you get.